HPLC, UHPLC
Profiling and Quantification of Mono and Disaccharides and Selected Alditols in Juice, Beer, Wine, and Whiskey Using UHPLC with Mass Detection
Jun 03 2016
Author: Mark E. Benvenuti, Gareth Cleland, and Jennifer Burgess on behalf of Waters Corporation
Sugars and sugar alcohols are classes of carbohydrates that are important in human nutrition and natural constituents of foods. With the increasing incidence of obesity and diabetes across the developed world, interest in monitoring sugar intake has vastly increased in recent years. Consequently, there are now requirements to provide accurate information on product labelling in order to comply with increasingly stringent regulatory demands. Profiling the sugar content of products is also a useful tool in assessing product authenticity and potential adulteration. The analysis of sugars and sugar alcohols remains a challenging application, owing to the lack of chromophores and the similarity between these molecules - many of these sugar compounds are isomers of one another. Due to its separation power, accuracy, and speed of analysis, HPLC has become the method of choice for the analysis of sugars. An alternative to RI and ELS detection is the use of mass detection with electrospray ionisation (ESI). Mass detection is complementary to traditional detectors used for LC. It offers the opportunity to decrease detection limits and also to obtain mass spectral information on the components in the sample. The combination of both chromatographic retention time and mass information results in increased selectivity for the analysis of sugars and sugar alcohols. Here we show the application of the Waters® ACQUITY® QDa® Detector (mass detection) coupled to the ACQUITY Arc System (UHPLC) for the profiling and quantification of sugars in juice, wine, beer, and whiskey samples.
Experimental
LC conditions
LC system: ACQUITY Arc
Data system: Empower® 3
Runtime: 40.0 min
Column: XBridge® XP BEH Amide 2.5 μm, 3.0 x 150 mm
Column temp.: 85°C
Mobile phase A: 90% acetonitrile: 5% IPA:5% water*
Mobile phase B: 80% acetonitrile: 20% water*
Flow rate: 0.8 mL/min
Injection volume: 1 μL
MS conditions
MS system: ACQUITY QDa (Performance mode)
Ionisation mode: ESI capillary
voltage: 0.8 V
Cone voltage: 5.0 V
Probe temp: 600°C
Acquisition rate: 2 Hz
Full scan: 50 to 800 Hz
Curve fit: Quadratic, 1/x weighting
Smoothing: Mean filter, Level 7
SIR channels:
Standard preparation
A 100 mg/L stock of the nine saccharides listed above was prepared in 1:1 acetonitrile-water. This stock was further diluted to produce nine individual levels (1, 2, 4, 5, 10, 20, 40, 50, and 100 mg/L).
Sample preparation
All samples were purchased locally. The juice samples assessed included orange, apple, pineapple, pomegranate, and grape.
The alcoholic beverages assessed included five beers, three lagers (one non-alcoholic), a lemon flavoured beer, one hard cider, one sherry, one red wine, and four whiskeys. The beer samples were sonicated to remove carbonation. All of the samples were filtered through a 0.22 μm PVDF syringe filter and diluted in 1:1 acetonitrile-water. The dilution factors are listed in Table 1.
Results and Discussion
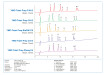
Figure 1 shows the SIR chromatograms for a mixed standard at
100 mg/L for fructose, glucose, arabinose, inositol, sorbitol, mannitol, sucrose, maltotriose, and maltose. Excellent separation of all of the standards was achieved. Initially, using isocratic conditions, the lower mass saccharides were separated, including the difficult pair sorbitol and mannitol. After 4.5 minutes a gradient was started that allowed timely separation of the larger molecular weight saccharides in the mix.
The mass spectra extracted from the SIR of each standard is shown in Figure 2. The use of guanidine chloride in the mobile phase ensured that the compounds were driven to their chloride adduct ([M+Cl]- ion). The smaller 37Cl adduct response was also present. Figure 3 shows the SIR chromatograms for a mixed standard at 100 mg/L for each of the analytes listed in the Experimental above. An R2 value >0.995 was achieved for all of the analytes.
Figure 4 (A–E) shows the SIR profiles of a lager beer. In Figure 4A (m/z 185) arabinose is present. Other peaks are also apparent, suggesting the presence of other pentose saccharides. In Figure 6B (m/z 215) traces of fructose and glucose can be seen. The enhanced sensitivity of the ACQUITY QDa allows improved detection of these compounds, as opposed to less sensitive methods such as Refractive Index [1]. In Figure 6C (m/z 217) traces of sorbitol and mannitol are present. We also saw small peaks representing the extraction of the 37Cl adducts of fructose and glucose, which have the same molecular weight as sorbitol and mannitol. In Figure 5D and 5E (m/z 377 and 539 respectively), we observed the DP2 and DP3 compounds maltose and maltotriose, along with isomers of the same mass, which would be expected for a beverage derived from grain.
A sherry wine profile is shown in Figure 5 (A–E). The main analytes found to be present in sherry are fructose and glucose (Figure 5B). A small amount of arabinose was present (Figure 5A), along with trace levels of sorbitol and mannitol (Figure 5C). Maltose was also apparent (Figure 5D). The DP3 compounds were absent (Figure 5E), as would be expected, since wine is derived from grapes rather than from grains.
Figure 6 (A–E) shows the SIR profile of a whiskey sample. The presence of arabinose (Figure 6A), fructose and glucose (Figure 6B) was evident. Of particular interest was an unknown saccharide apparent in Figures 6B (m/z 215) and 8C (m/z 217) at retention time 4.85 min. Using retention time alone with an RI or ELS detector, this peak would most likely have been misidentified as mannitol. The presence of this peak at both m/z 215 and m/z 217 indicated that this component has the same mass as a monosaccharide, rather than an alditol. Mannitol does not have an ion at m/z 215, as can be seen in Figures 1 and 2. Finally, the SIR chromatograms from an apple juice sample are shown in Figure 7 (A–E). The presence of arabinose, fructose, glucose, sorbitol, and sucrose are highlighted.
The quantification of various fruit juices is shown in Table 2.
Fructose, glucose, and sucrose were present in the orange, apple, and pineapple juices. The amounts and ratios of sugars in these juices are similar to those reported elsewhere [2,3]. Of particular interest was the detection of sorbitol in pomegranate juice. Sorbitol is not usually present in pomegranate juice [4] and its detection could be evidence of adulteration. The grape juice sample showed fructose, glucose, but no sucrose as expected [2,3].
Figure 7. SIR profile of an apple juice sample annotated with saccharides found to be present.
Table 2. Calculated concentrations from the quantification studies of the various fruit juices profiled in this study (g/L).
Conclusions
• The ACQUITY QDa Detector coupled to the ACQUITY Arc System provides improved sensitivity and selectivity to analyse and quantify mono and disaccharide samples in a single injection.
• Mass detection is a viable alternative to Refractive Index (RI) or Evaporative Light Scattering (ELS) methods.
• This enhanced sensitivity allows the analysis of samples at higher dilution levels, which minimises matrix effects.
• The combination of mass detection and chromatographic
separation provides increased selectivity in identifying analytes of interest, while reducing false positives.
References
1. M Castellari et al. Determination of Carboxylic Acids,
Carbohydrates, Glycerol, Ethanol, and 5-HMF in Beer by
High-Performance Liquid Chromatography and UV–Refractive Index Double Detection. Journal of Chromatographic Science. 39: 236–238, January 2001.
2. M L Sanz et al. Inositols and carbohydrates in different fresh fruit juices. Food Chemistry. 87: 325–328, 2004.
3. M Benvenuti. Analysis of Food Sugars in Various Matrices. Waters application note no. 720004677EN, May, 2013.
4. R Jahromi. 6.21 Reference Guide for Pomegranate. Revision June 2012.
Digital Edition
Chromatography Today - Buyers' Guide 2022
October 2023
In This Edition Modern & Practical Applications - Accelerating ADC Development with Mass Spectrometry - Implementing High-Resolution Ion Mobility into Peptide Mapping Workflows Chromatogr...
View all digital editions


Events
Jan 20 2025 Amsterdam, Netherlands
Feb 03 2025 Dubai, UAE
Feb 05 2025 Guangzhou, China
Mar 01 2025 Boston, MA, USA
Mar 04 2025 Berlin, Germany