-
 Figure 3 – Rs-Map Response
 -
 Figure 1 – Non-ionising Peak
 -
 Figure 2 – Non-absorbing Peak
 -
Figure 3 – Rs-Map Response
-
Figure 1 – Non-ionising Peak


LC-MS
Fusion QbD® now has MS/UV Based Peak Tracking and Rs-Map Modeling
Mar 27 2019
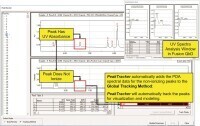
Fusion QbD’s new PeakTracker™ automates and simplifies the use of PDA and MS spectra data in LC and LC/MS method development. The new Rs–Map Response feature generates predicted resolution results (USP or EP/JP) for all peaks and associated Rs-min graphs across all experimental conditions.
PeakTracker (Figures 1 and 2) uses 3D PDA spectral data augmented with standard UV peak results data to automatically identify each peak in each experiment chromatogram. PeakTracker will also fully utilise 3D mass spectral data for experiments run on LC systems configured with the Waters Acquity QDa Mass Detector (QDa). Complex separation and tracking challenges PeakTracker can automatically address include:
- Auto-deconvolution of partially and completely co-eluted peaks.
- Two or more peaks with identical mass data.
- Non-ionising and non-absorbing compounds.
PeakTracker automatically associates compound names with all of the UV results data computed by the CDS for all identified peaks in each experiment chromatogram. It also automatically deconvolutes co-eluted peaks, and updates missing UV results data for co-eluted peaks. PeakTracker displays the UV chromatogram and also the Total Ion Chromatogram (TIC) when available. It also displays the PDA and MS spectra data – both numerically and graphically – as visual aids to its tracking, and to allow users to update tracking results – both globally across all chromatograms and for individual peaks in individual chromatograms. In addition, PeakTracker will automatically add peaks which are identified in the TIC – but which are not UV absorbing – into the UV experiment chromatograms, and also generate the critical peak data sets used in robust method optimisation modeling.
Rs–Map Response (Figure 3) consists of automatically generated USP or EP/JP resolution predictions for all peaks for any given set of experimental conditions, along with associated Rs-min graphs across the full experimental region. Fusion QbD generates the Rs–Map Response predictions according to standard USP or EP/JP resolution equations using its hyper-accurate Retention Time and Peak Shape Parameter modeling technologies. Fusion QbD then displays Rs-min contour graphs, overlay graphs, or 3D response surface graphs, along with the associated prediction chromatogram and resolution results data table for all peaks– all of which update in real time as you change chromatographic method conditions. You can dynamically set a minimum resolution requirement threshold, and Fusion QbD will update the Rs–Map Response graphs plot to visually display the regions of the graph which correspond to methods which do – and do not – meet your specified performance requirement. Your threshold will also be reflected in the prediction chromatograms and associated Resolution results data table. The Rs–Map response data can also be coupled with Fusion QbD’s numerical and graphical Best Answer search capabilities, as well as its fully integrated Robustness Simulator capability.
For further information please click here.


Events
May 11 2025 Vienna, Austria
May 18 2025 Tempe. AZ, USA
May 21 2025 Birmingham, UK
Jun 01 2025 Baltimore, MD, USA
Jun 15 2025 Bruges, Belgium