Autosamplers
Understanding the Difference Between Retention Time and Relative Retention Time
Aug 01 2014
Retention Time
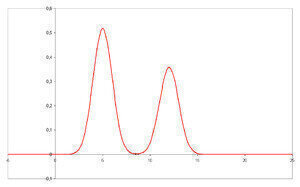
Retention time (RT) is a measure of the time taken for a solute to pass through a chromatography column. It is calculated as the time from injection to detection.
The RT for a compound is not fixed as many factors can influence it even if the same GC and column are used. These include:
- The gas flow rate
- Temperature differences in the oven and column
- Column degradation
- Column length
These factors can make it difficult to compare retention times. Even if you use the same GC just a few days apart, there can be small differences in the retention time of a compound.
Qualitative Analysis
Qualitative analysis relies on comparing the retention times of the peaks in an unknown sample with those of known standards. If the retention time of a peak in the unknown sample is the same as the standard then a positive identification can be made.
|
Peak Number |
Standard Identification |
Standard RT / minutes |
Sample X RT / minutes |
Sample Y RT / minutes |
|
1 |
1.33 |
1.27 |
||
|
2 |
A |
1.45 |
1.44 |
1.39 |
|
3 |
B |
3.07 |
3.06 |
2.96 |
|
4 |
3.34 |
3.26 |
The results from three GC runs are shown in the table. The Standard and Sample X were run consecutively. Sample Y was run a few days later. From the retention times we can state, quite reasonably, that Sample X contains components A and B. However, no positive identification could be made for Sample Y based on a comparison of the retention times. The peak in Y with a retention time of 1.39 minutes could be component A, or it could be the component in X that elutes at 1.33 minutes.
A method that can reduce the effect of small changes in GC parameters would be beneficial for qualitative analysis.
Relative Retention Time
The use of the relative retention time (RRT) reduces the effects of some of the variables that can affect the retention time. RRT is an expression of a sample’s retention time relative to the standard’s retention time.
RRT = Standard RT / Sample RT
To measure RRT, a sample matrix is made up by mixing the sample with an internal standard (IS). Using the data from before, but this time with an IS:
|
Peak Number |
Standard Identification |
Standard RT / minutes |
Sample X RT / minutes |
Sample Y RT / minutes |
|
1 |
1.33 |
1.28 |
||
|
2 |
A |
1.45 |
1.44 |
1.39 |
|
3 |
IS |
2.90 |
2.89 |
2.78 |
|
4 |
B |
3.07 |
3.06 |
2.96 |
|
5 |
3.34 |
3.21 |
From the data we can calculate the RRT of the peaks in X and Y.
|
Peak |
Standard RRT |
Sample X RRT |
Sample Y RRT |
|
A |
RRT = 2.90/1.45 = 2.00 |
RRT = 2.89/1.44 = 2.01 |
RRT = 2.78/1.39 = 2.00 |
|
B |
RRT = 2.90/3.07 = 0.94 |
RRT = 2.89/3.06 = 0.94 |
RRT = 2.78/2.96 = 0.94 |
From the RRT data, components A and B can be identified in both of the samples.
The use of retention time as a qualitative tool is described in the article: Volatile Organic Compound Determination in Health-related Research: A Review.
Image Source


Events
May 18 2025 Tempe. AZ, USA
May 21 2025 Birmingham, UK
Jun 01 2025 Baltimore, MD, USA
Jun 15 2025 Bruges, Belgium
Jul 14 2025 Kuala Lumpur, Malaylsia